-
Your shopping cart is empty!
 Suitable for TOYOTA HILUX D4-D CHIP FINE TUNING 07-11
 Suitable for TOYOTA LC78 TROOPY 4.5 V8 CRD
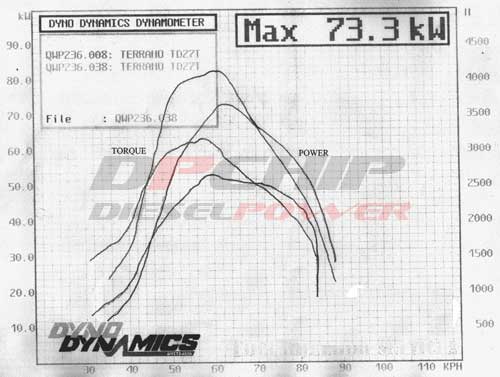 Terrano TD27
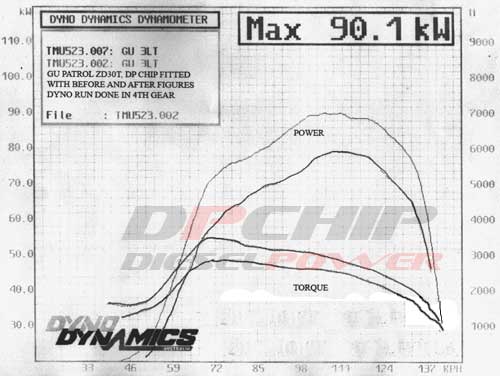 Nissan GU Patrol
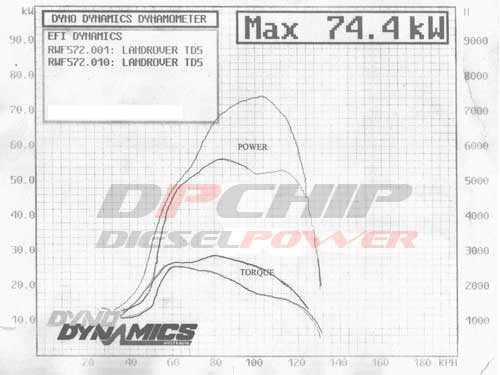 Land Rover TD5
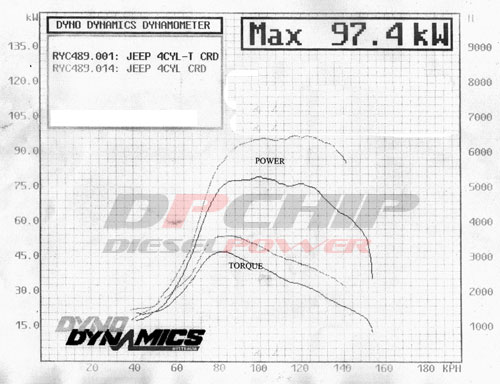 Common Rail Jeep Cherokee 2.8L 4Cyl
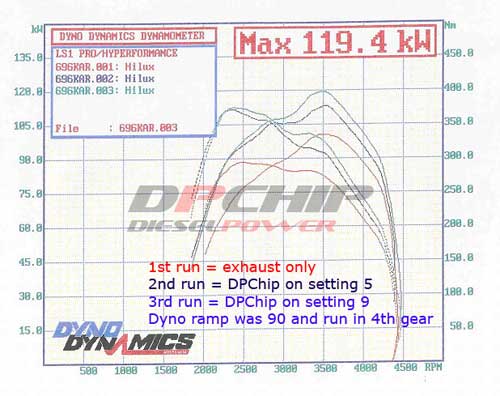 Suitable for Toyota Hilux 2006 1KDFTV Engine
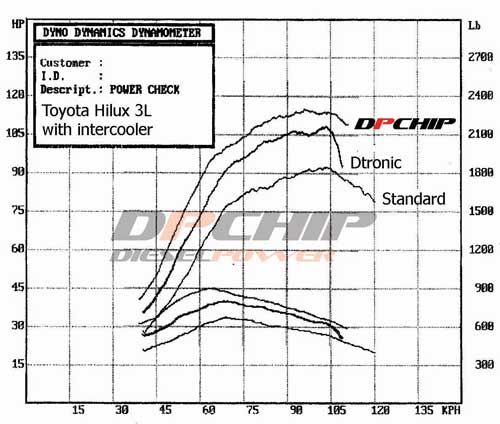 Suitable for Toyota Hilux 3L with intercooler
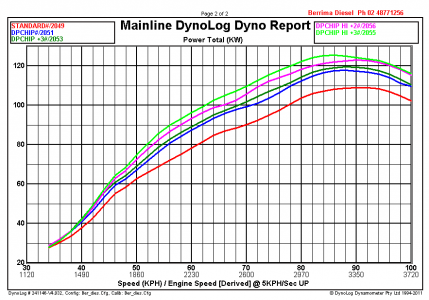
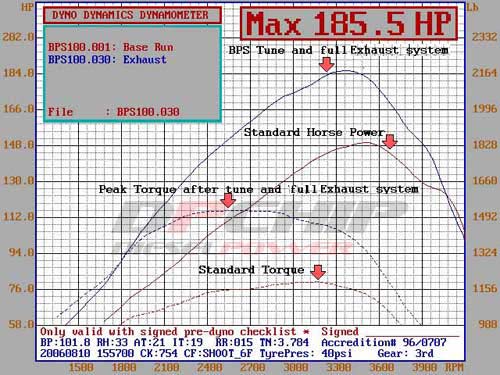 Suitable for Toyota Landcruiser 100 Series with 3″ Exhaust and DPChip
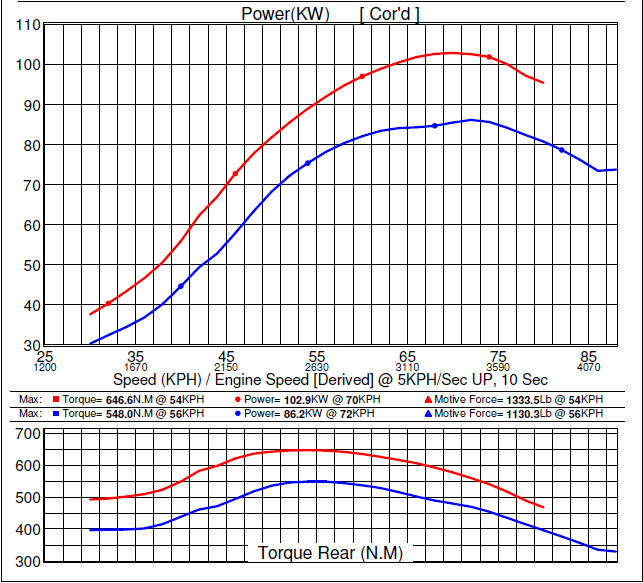
Suitable for Toyota Prado 150 Series
Suitable for Toyota Landcruiser 100 Series with 3″ Exhaust and DPChip
Suitable for Toyota Prado 150 Series
Dyno results are not the ‘Be all and end all’ of tuning and really should be used as a guide to understanding the operation of the engine. There are many factors that effect a dyno result:- the dyno operator, daily weather conditions and how the results are translated to the customer.
ALL manufacturers engine power specifications are measured at the engines crankshaft. These manufacturers specifications are never checked or questioned by any independent authority. The engine power specifications listed here by DPCHIP are ‘converted or calculated’ figures and are to be used as a guide to the power gains you will get from installing a DPCHIP Simple put, to make figures comparative, given that the manufacturer only offers crankshaft power and we measure only power at the wheels, we have calculated wheel power back to a comparative crankshaft power.
- Remembering that Power and Torque come from a mathematical calculation, not all dyno’s will read ‘True Horsepower’. Use the information a guide at that particular time more than as a fact.
- We are all human and have good and bad days. Dyno operators are also under time constraints to get the next car finished. A good operator will know his dyno well and know when he has gathered enough runs to form an average that can be used to come up with an informative result.
- Not one vehicle is the same. Always consider Tyre size and Tread pattern and Vehicle Weight as key that can affect vehicle performance. Just 10% higher in ratio can shave 10% off a dyno result and power on the road.
- The more questions you ask the better. The more information on the dyno graph the better. Ask for Power, Torque, AFR exhaust and Boost readings where possible.
- Most dyno testing starts off with a Standard vehicle at normal temperature. During the set up phase of locking the vehicle down on the dyno the engine would be considered ‘rested and warm’. Initially a few runs Standard would be performed. This would start to heat up the engine and component such as Intercooler etc. Generally next an operator would add the chip and do more runs. It’s common for dyno operators to forget to consider modern Diesel engine management systems sensitivity of heat and tune and allow for components that gain heat soak. A common scenario is often for a dyno operator to do more and more runs creating more and more heat soak. In turn actual power dropping so as the chip looks like it’s not or just working. If this is in question its always advisable to finish dyno testing with a Standard engine again so as to compare runs of equivalent heat soak. Doing multiple dyno runs chipped, not chipped and chipped again can allow proper true power gains to become apparent.
- ‘Seat of the pants’ you will feel a little more ‘urgency’ in the roll on power of the engine. Light throttle applications will also be more responsive. Remember this is a ‘fine tune’ but not a ‘racing tune’ so the gains will be firm and smooth.
- More power for the same throttle position means more chance being in a higher gear. A higher gear means less engine RPM means less fuel used. Expect a minor benefit to economy on average.
There is much deliberation around the industry about dyno accuracy. Just how accurate are the dyno power readings? Why does the same car get different results on different days? Why does the same car get different results on dynos from the same manufacturer and from different manufacturers? One needs only to peruse some of the “forums” on the internet to see that there can be significant differences in the results produced by the same vehicle when run on different brand dynos and even on the same brand of dyno. But some people say that the accuracy of a dyno is not as important as its ability to reflect the outcome when modifications are made to a vehicle, and its repeatability. Others say a dyno is only useful as a tuning tool and does not need to be relied upon to be accurate. Is it any wonder people get confused? Read on to get an understanding of the reasons behind the variations in results.
Once upon a time, there were really only 3 key reasons why a vehicle could show a different power reading on the same Dyno at different periods in time, they are:
1. The Dyno was not correctly calibrated.
2. The Atmospheric (Weather) Conditions had changed.
3. The Vehicle had a problem that affected its Power Output.
Early chassis dynos were only able to apply load, and subsequent models were extended to measure some basic outputs like torque, power and speed. The dyno operator had little influence over the dyno and had to accept the results that the dyno produced. Now, would it not follow that if the vehicle was unchanged and weather conditions were constant, that one vehicle could be expected to produce at least similar results on several of the same brands of dyno, or all dynos for that matter? Is incorrect calibration likely to be a factor? Perhaps, but with modern dyno hardware, a dyno is not likely to lose calibration through normal use. Dynos that are available these days have mostly evolved into state-of-the-art diagnostic tools and keep pace with the high-tech advances in motor vehicle technology. The better quality dynos can now generate vehicle specific information and a level of accuracy that was not conceivable even a few years ago. Faster computers and the flexibility of the Microsoft Windows operating system have given dyno programmers a far more powerful tool than they have ever had before. So what other factors are involved? We would surely all agree that any dyno manufacturer worth their salt is interested in producing accurate and honest results from their dyno. An intrinsic part of producing accurate, honest and consistent results from a dyno requires that the dyno dictates the power produced by a vehicle without undue influence from the dyno operator. Let’s look at how results can be influenced.
The evolved dyno operator of today has much greater influence over the results produced on a dyno than ever before, and the dyno operator has become another reason why a vehicle can show different power readings on the same dyno at different periods of time. Is it possible that at least some operators would mislead a customer about the extra power produced by an aftermarket add-on or a performance tune if they were able to do that? In a market place where more power seems to be better, would it be in a dyno operator’s interest to satisfy a vehicle owner’s desire for high power figures? Many dyno manufacturers have ensured that the “operator factor” is eliminated as far as possible, meaning that they lock the operator out of areas of the dyno controller where results can be “influenced” and follow a policy where all relevant dyno run factors are displayed on run files and printouts so that any attempt that has been made to manipulate the results can be easily identified. But not all dyno manufacturers have taken that approach. At least one brand of dyno has built in an easily accessible “correction factor” that the dyno operator can use to increase or decrease the results produced, and so, for example, in the hands of an unscrupulous operator, the “correction factor” could be used to mislead a customer about extra performance when no performance benefit was actually achieved. It could also be used to convince a vehicle owner that a vehicle generates far more power than it is capable of.
Another example of why sometimes people get curious dyno results from different dyno brands is because one dyno manufacturer may attempt to factor in Vehicle Inertia while another may not. Vehicle inertia is best explained as this. If you are accelerating a car, then part of the torque produced is consumed to accelerate all of the rotating components of the car, ie Wheel/Tyres, Driveshafts, and Gears, etc. This is not Driveline Loss, Driveline Loss is the friction generated from gears, bearings, universal joints and Tyre to Roller contact. There is nothing wrong with trying to account for vehicle inertia, provided it is used correctly. The problem with applying vehicle inertia is that not every car is the same. For example, if you were to change from 16” Rims to 19” Rims on a car, you have effectively changed the vehicle inertia, because with inertia the further the mass is from the centre of a rotating object, the more inertia there is. So on a dyno that uses vehicle inertia correction, an operator may specify inertia value for a vehicle; say for example a Toyota Fortuner. A common modification on the Fotuner is to change the wheels and rim size could vary from 16” to 19”. One model might also have steel rims while another has nice light alloy rims. It is easy to dismiss this an unimportant, however do not underestimate the difference in tyre/wheel combinations as the Tyre/Wheel is responsible for around 80% of the Vehicle’s Drive Train Inertia because these items have a much larger radius than any other component in the drive train. A difference of 11HP can be seen on a Subaru WRX by just changing from one tyre/wheel combination to another. The chance of over or under applying Vehicle Inertia is fraught with inaccuracy and can provide misleading results, and some dyno manufacturers choose to steer well clear of it. They take the view that at the end of the day, a dyno is measuring how much power is actually getting to road surface, and the power that gets to the road surface (Motive Force) will govern just how quick a car really is.
Modern dynos also have the ability to correct power on the basis of changes to weather conditions. A short explanation is needed here to fully understand atmospheric correction. Atmospheric correction is applied to compensate for changes to the combustive properties of the ambient air (the quantity of oxygen per unit volume) in an attempt to provide a level playing field between dyno runs. Atmospheric Correction Standards are defined by organizations such as SAE, ISO, DIN, ECE etc and each uses a slightly different way of measuring change. Using the widely accepted SAE J607 standard, on an ideal day when the temperature is 15 degrees Celsius, and there is 0% humidity, and the Barometric Pressure is 1015mbar, zero power correction is applied. Variations in any of these three atmospheric factors will either cause positive or negative power correction to be applied. If the temperature changed to say 19 degrees Celsius, the humidity to 34% and the Barometric Pressure to 989mbar, the conditions are not as ideal and the vehicle will not make as much power. By applying the SAE J607 atmospheric correction (in this case +3.89%), the power readings are corrected to what the vehicle could be expected to make on an “ideal” day. The amount of power correction applied to a vehicle always needs to be an accurate reflection of how much power is actually lost by or gained by the vehicle as a result of unfavorable weather conditions. The SAE J607 standard specifies a maximum ceiling of 10% power correction, on the basis that any power correction in excess of 10% will produce a power figure that cannot necessarily be reproduced by the vehicle under optimum conditions.
So, a dyno that can accurately correct vehicle power according to changed weather conditions should produce more consistent and accurate results from run to run. A dyno that cannot correct vehicle power according to weather conditions or where weather conditions have not been regularly updated can produce results that vary considerably from run to run. A 5ºC inaccuracy in air temperature can lead to a 0.9% change in power figures. A 3 mBar (normal range 900 to 1050 mBar) inaccuracy in barometric pressure give a 1% change in power.
Follow these golden rules to limit the variations in results between dyno runs and give you a better idea as to whether the results of a dyno run can be relied upon to be accurate:
1. Dyno Printouts should always clearly show which atmospheric correction standard was used (eg SAE, ISO) AND how much atmospheric correction has actually been applied to arrive at the end result.
2. Be wary of any dyno that uses uncapped correction, as it can produce figures that can never be reproduced even under ideal weather conditions. If the percentage correction that has been applied is not specified, there is a good chance that uncapped correction has been applied
3. If the dyno uses the air intake probe temperature to calculate atmospheric correction, make sure that the probe is not improperly placed during the dyno run, and check that the ambient temperature and the air intake temperature on the printout are not unreasonably different.
4. Use a dyno that provides automatic correction from an inbuilt weather station, or make sure that the atmospheric conditions have been updated just prior to the dyno run if the dyno cannot provide automatic atmospheric correction.
5. Make sure that the operator uses consistent test parameters (gear, start speed, end speed, ramp rate) for multiple runs so that any variations in results are from the vehicle and not the way it is tested.